
This post is special for binary traders . I am posting 4 Top Sureshot Pattern in Quotex and Tradowix , which will help you increase your trading knowledge and ease in profits.
What are trend lines? in Sureshot Pattern in Quotex
Our first topic in “4 Top Sureshot Pattern in Quotex” is the trend line, which is a line we draw on our charts that connects the swing highs and swing lows during a trending market. Here, we have a clear downtrend with a run , a pullback, a run, a pullback, and a run. At the bottom of each run before the pullback begins , this is what we call a swing low. At the top of each pullback before a run begins, this is what we call a swing high. In an ideal downtrend, this means that the price will be making lower highs and lower lows.
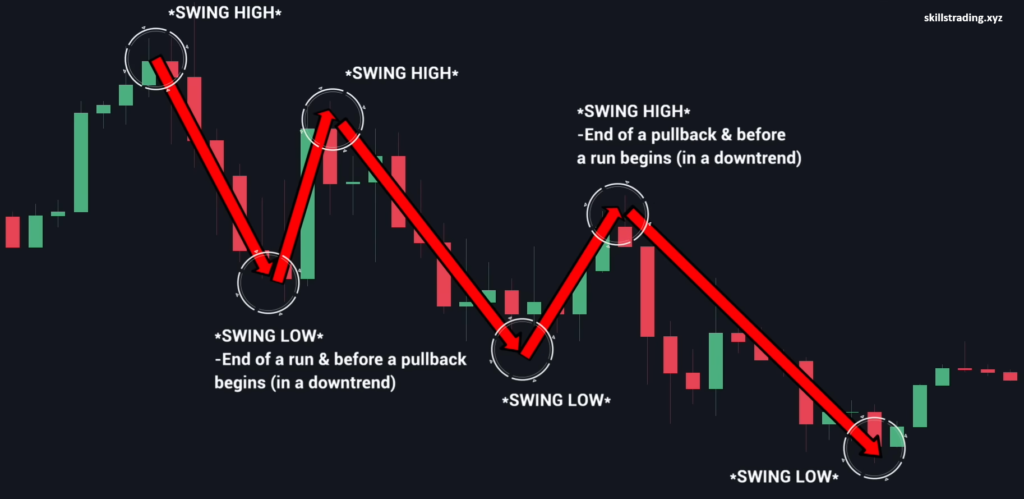
Now a trend line is applied to connect the swing highs along the top and swing lows along the bottom. So let’s move on to an uptrend . Here we have a clear uptrend; we have a run, a pullback, a run, a pullback, and a run. At the top of each run before the pullback begins, this is what we call a swing high . At the bottom of each pullback before a run begins, this is what we call a swing low. So what this means is that in an ideal uptrend, price will be making higher highs and higher lows. Now our trend line is applied to connect the swing highs along the top and swing lows along the bottom.
Now this is an important point: price won’t always move this smoothly in trending markets, but we are showing you this as a reference to what ideal trending price movement looks like . So why exactly do we draw trend lines? The first reason is that trend lines can act as a form of support or resistance. Along the top, the trend line acted as resistance when price touched it, and along the bottom, the trend line acted as support when price touched it. You don’t enter trades blindly just because price has touched a trend line; you always wait for price action in combination with other factors.
Now the second reason we draw trend lines is that a break of a trend line can signal a possible trend change. So in a downtrend, we have our trend line placed above the trend. When price breaks this trend line, it can signal a possible trend change to an uptrend. Now vice versa, in this moving uptrend, we have our trend line placed below the trend, and when price breaks this trend line, it can signal a possible trend change to a downtrend. You have your moving uptrend; we have our trend line placed along the bottom of the uptrend. Once the price breaks this trend line, it signals a possible trend change to a downtrend. Again, once this downtrend starts , we put a trend line above the moving downtrend, and once price breaks this trend line, it signals to us another possible trend change to an uptrend. Again , here were your trend lines before you had your breaks and then trend changes.
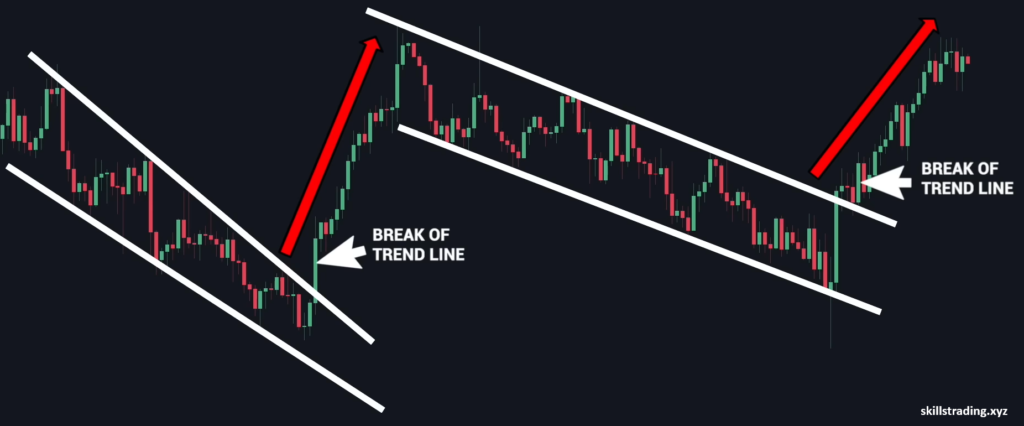
This is a very important point what we just showed you is what occurs in an ideal situation but is not the law, you need to pair these trend line breaks or rejections with key price action factors before looking for a trade entry.
How to Draw a Trend Line in 4 Top Sureshot Pattern in Quotex and Tradowix
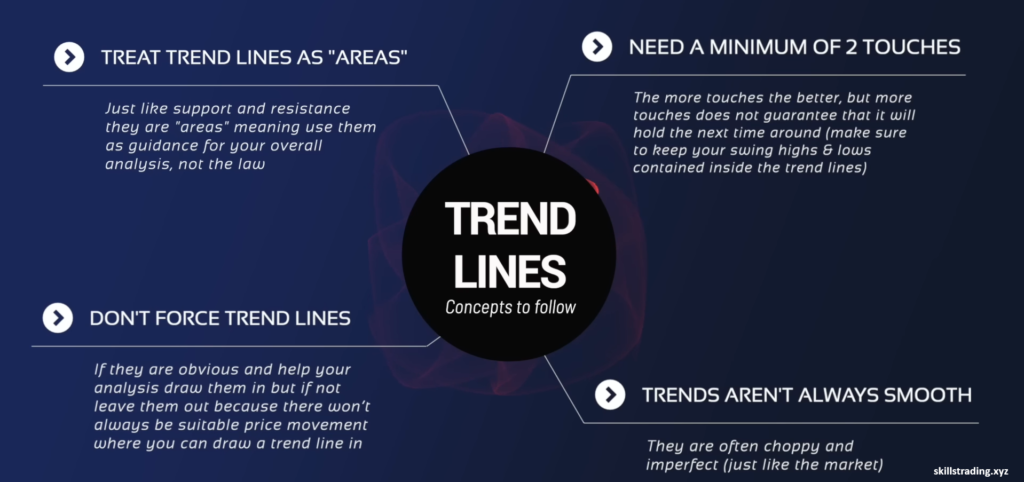
What are trend lines, and why do we apply them to our charts ? Let ‘s go in-depth on how to draw trend lines effectively. First, let’s review the concepts we follow when drawing trend lines :
1. You need a minimum of two touches to be able to draw a trend line . The more touches, the better, but more touches do not guarantee that it will hold the next time around .
2. Trends don’t always move smoothly ; they’re often choppy and imperfect.
3. Treat trend lines as areas , meaning use them as guidance for your overall analysis, not as law.
4. Don ‘t force trend lines. If they are obvious and help your overall analysis, draw them in, but if not, leave them out. There won’t always be suitable price movement where you can draw a trend line on it.
Ideal Trend lines
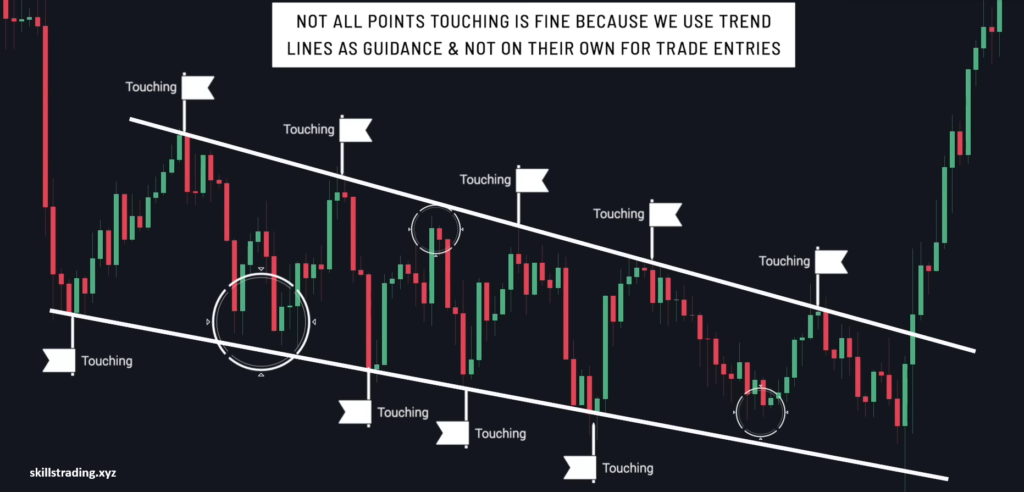
What is the ideal best-case scenario? Trend lines will look like this. Now, here is your current moving downtrend. Click on your line drawing tool , start from past the first swing high, and drag the line down, connecting the two points. Also, make sure when you draw your trend line, to have it extended further down, because if the price makes it back up to this trend line in the future, you want to have it ready there as a reminder to look. The last trend line would have been drawn before the price broke the trend line. Now, if you want, you can also draw this longer-term trend line along these higher points like this. Next, moving down again , we connect the swing highs along the top and the swing lows along the bottom. This is an important point to discuss: there isn’t always a trend line you can draw, as there isn’t always going to be suitable price movement for a trend line to be applied to it . To the left here, we had good price movement where you would have had two trend lines applied before the price broke the bottom trend line and started a downtrend. But now, looking at the current trend, there isn’t suitable price movement to apply a trend line. You could apply a super-tight trend line like this, but that does not help your overall analysis . In this case, we leave it out. So let’s get into imperfect trend lines. A type of imperfect trend line you will often see is when not all the points are touching. What this means is that when you draw a trend line, you won’t always be able to connect all the swing highs or swing lows. So, in that case, just draw your trend line where it can touch the most amount of points and leave the other points out . So here is a clear moving downtrend. Let’s go ahead and apply our trend lines where we can get as many touches as possible . Now notice how these points here all touch the trend line, but these points here do not touch , and that is perfectly fine. Because again, we use trend lines as guidance; we don’t use them on their own for trade entries.
So let’s discuss another example. Here we have our clear downtrend . We place our trend line along the top, connecting the swing highs, and we place our trend line along the bottom, connecting the swing lows. Now, again, notice the points that we were able to connect with the trend line and the points that didn’t quite reach the trend line, which is fine . Now, this leads us to a question we often get asked, which is: do you draw your trend line through the candle closes, candle bodies, or wick ends? At this point , you should already know the answer, which is to draw your line in an area where you can get the most amount of touches. This means the line you draw will hit both wicks and candle bodies, depending on the trend you are looking at. So here was your clear downtrend in the given image, and in order to hit all these points, this is where you would have placed your trend line . Now notice how at this point here , the trend line is at the wick end, and again at this point here, the trend line is at the wick end. Now, at this third point, the trend line is piercing the wick and touching the candle body, which is necessary in order to be able to hit the following points. So again, the trend line hits the candle body, and here the trend line hits the wick end, and here the trend line hits the wick and body, as seen in the image below.
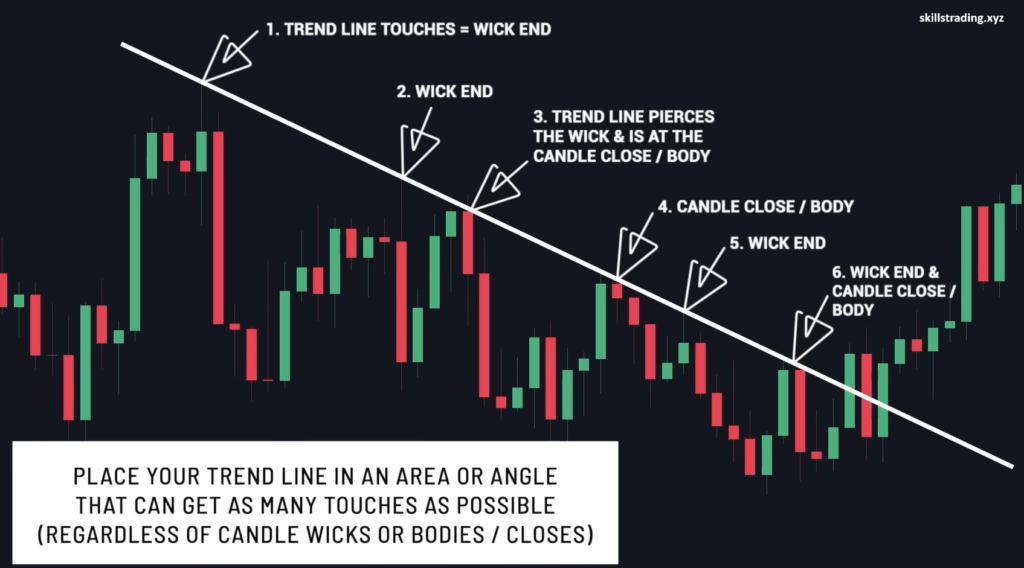
How the trend line hits candle closes and wicks allows us to get the most touches on price, and it finally breaks out, starting a trend change. Similarly, along the bottom, our trend line would be placed like this so that we can hit all three points . Let ‘s do this one more time: you’re in a clear downtrend. Along the top , we would place our trend line like this again; wick ends don ‘t touch candle close, wick end, and along the bottom. We would place our trend line like this, so don’t think too hard about this because, again, we use trend lines as guidance and treat them as areas, not a solid line.
Trend lines and price action
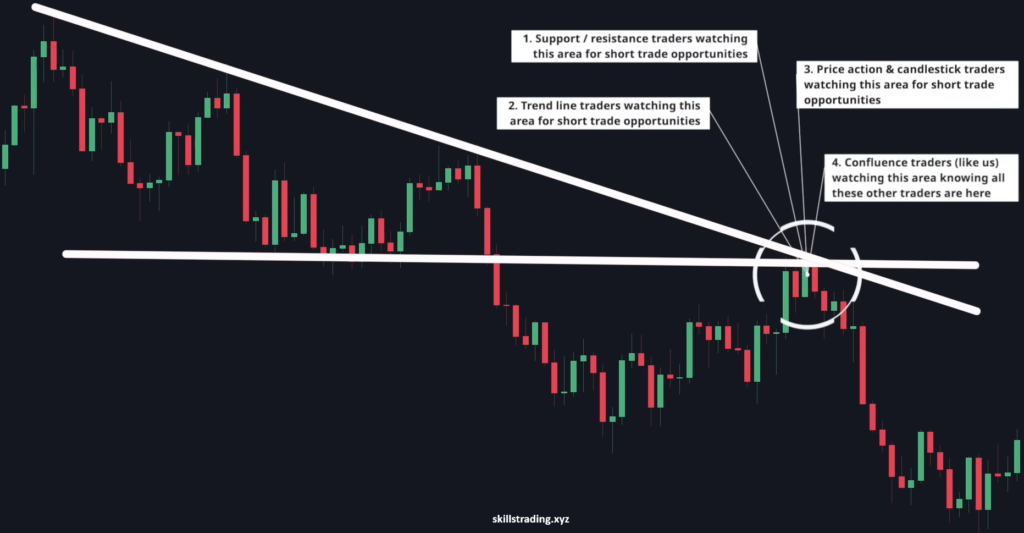
We use trend lines in combination with price action in two key ways. The first is for trend trading, and the second is for reversal trading. Let ‘s start with the first, which is trend trading with trend lines. Now, here is exactly what you want to look for when trend trading with trend lines: an area where support or resistance crosses with a trend line . This access point is also what we call an area of high confluence. An area of high confluence is an area where a lot of traders have their eye on , meaning that there is a higher probability that traders will be taking action out of these areas, which is when trade opportunities arise. So, let’s take this one step further. This area is of high confluence because different schools and types of traders are all watching it. First, you would have support and resistance traders eyeing this area for possible short trade entries. Second, you would have trend line traders eyeing this area for possible short trade entries. Third, you would have price action and candlestick traders eyeing this area for possible short trade entries. And fourth, you would have confluence traders like us who are eyeing areas like this, where we know other schools of traders are watching for possible short trade entries. All these different types and schools of traders with different trading styles, all eyeing this area for possible short opportunities, is what can trigger a possible short trade entry now.
Let ‘s break this down step by step regarding what should be going through your mind as a trader. Also, to point something out, we are only using one time frame in this example, which is the daily time frame, and the reason this is important. First, you would have established that this is a moving downtrend as the price was making lower highs and lower lows, so you would want to trade with the moving downtrend. Second, you would have identified your trend line through these three points and drawn it in, stretching it out further in case the price came back up to it. Third, you would have looked left and spotted the support-turned-resistance level here and had it drawn in. Fourth, you would have then identified this area of high confluence where your trend line and resistance level intersected, which means there would be possible short trade opportunities once the price got here. Fifth, when the price started to approach this area, since you had this area already identified, you were watching to see what price would do once it got here, okay? Price action . So you were probably thinking, “Why not just enter a short trade right away once the price got to this access point ?” It does not matter how good an area is; you do not enter trades blindly once the price gets to these areas. You always wait for price action, because price can easily blow right through. You then had a reaction to the level through these two red candlesticks , not breaking through and bouncing downwards. Now, at this point, there is still no short trade because a reaction to an area does not equal a reversal. It could just bounce or stall at a key area and then still break right through. Do not forget that this is a moving uptrend. Now, here is the trick: to enter after a rejection of a key area of confluence , you put a trend line under the immediate moving trend and wait for a break of the trend line to confirm that the moving uptrend is over and that the bigger downtrend can continue . This is a very important concept to understand because even though your bigger trend is a downtrend, your immediate trend is an uptrend, and the moving uptrend can continue and break right through , triggering a larger trend change . This is why it was so important for the short-term trend to be over through the trend line break so that the bigger trend can continue. Now, the most important point here is that the break of the short-term trend line occurred after the rejection and bounce from an area of high confluence, or else you would have just had a short-term trend line break and nothing else. Now, this is a lot to take in, so let’s recap this one more time to drive the point home. First, your big-picture trend was a downtrend, so you had a big-picture bearish bias. The problem is your short-term trend was an uptrend, meaning price is currently moving with bullish momentum and can easily break right through your long-term trend line. This is why we needed to wait and see if we could get bearish price action to occur inside this short-term uptrend so that the short-term trend would be bearish to match the long-term bearish trend. Your bearish price action then came in two parts: the first was a reaction to the access point and area of high confluence, but more importantly, the confirmation of this was through the break of the short-term trend line. At this point , the short-term trend was bearish to match the big-picture bearish downtrend, and you could then take a trade on the break of the trend line, a trade through the intraday timeframes, through a momentum play or using any of the other strategies.
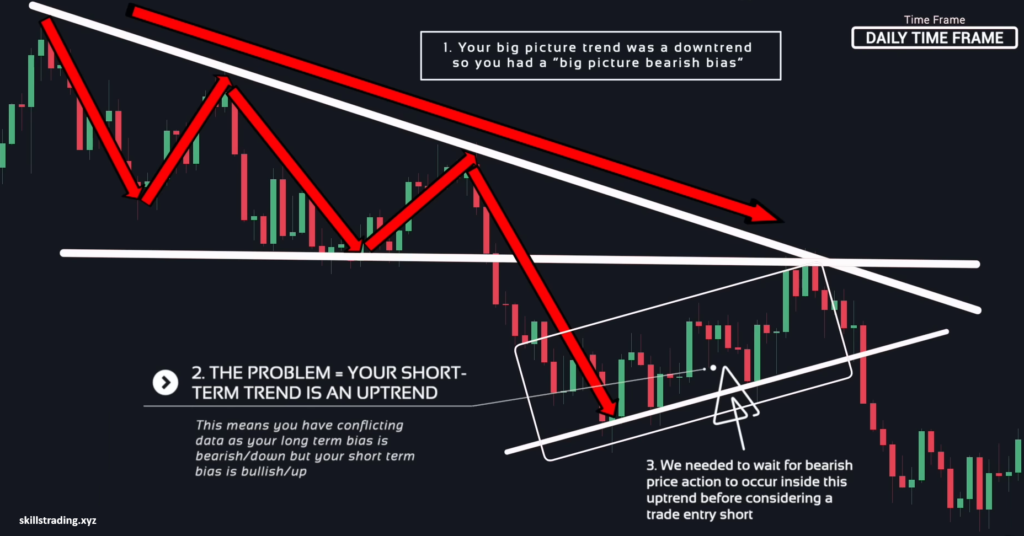
as you now have your directional bias confirmed as short or down now here is where you take your trading to the next level if we had good candlestick patterns occurring right at this access point here you would have placed a very short term trend line up tight like this and waited for a break of this tight trend line on the lower timeframes.
We will cover some more important points and reaming topic 4 Top Sureshot Pattern in Quotex strategies , I will post Part 2 of this strategy. For remaining topic, Visit this strategy Part 2 page,
Pingback: 100 % Wining Bug for Quotex and Tradowix - skillstrading.xyz