
In 2026 Quotex and Tradowix Best Strategy, This 3 Simple Moving Average strategy works on all platforms Like Quotex, Tradowix, Pocket option and other binary brokers. When the three moving averages cross and the blue line is on top while the red line is at the bottom, take a sell trade. When the three moving averages cross and the red line is on top while the blue line is at the bottom, take a buy trade. Use 15-second candles and set your trade expiry to 1 minute. Best times to trade European session and New York session. Avoid trading during major news events.
Settings
Moving average SMA Strategy settings
SMA 7
SMA 9
SMA 14
Chart Time Frame 15 Seconds
Trade Expire Time 1 Minute
Strategy # 01 Explanation
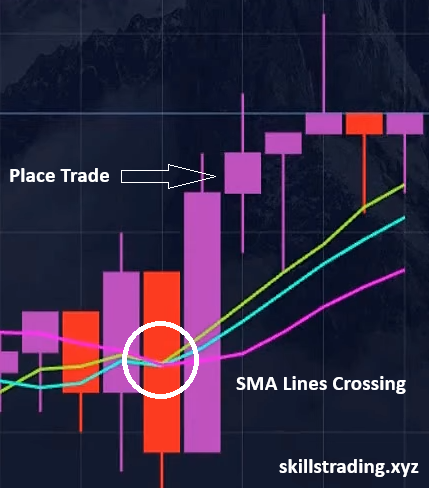
The three simple moving averages, SMAs have crossed each other. The blue SMA is now on top and the red SMA has moved to the bottom. This is a perfect confirmation for a sell trade according to our strategy rules. Look at the red candles forming. This is a strong downward trend showing clear bearish momentum. Go for sell trade right after the crossover.
This strategy works best in clear trending markets. So, always check for market conditions before placing your trade.
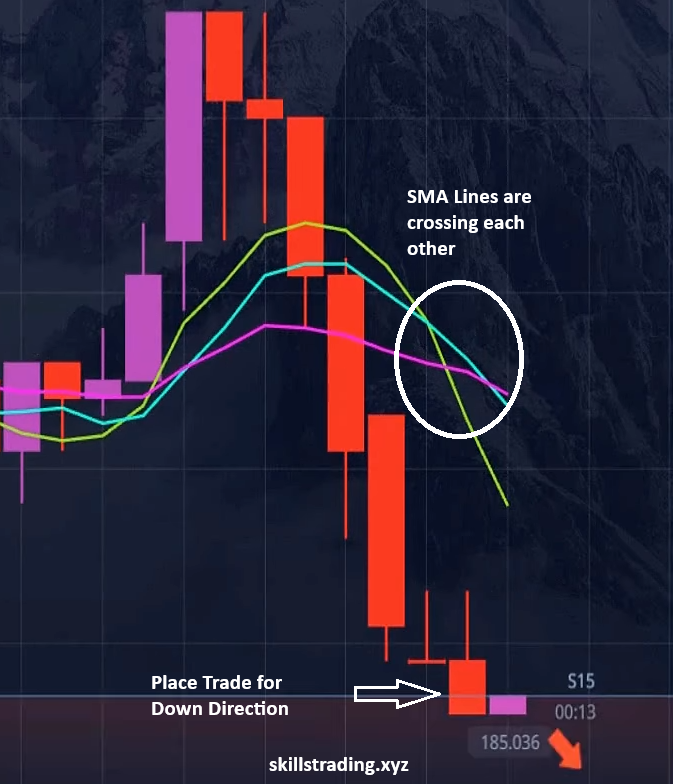
Here’s another example. we can clearly see that all three simple moving averages have crossed each other. The blue line is on top and the red line has dropped to the bottom. Exactly what we look for before, This setup signals that the market is likely to continue moving downward and we want to take full advantage of that. As soon as the crossover confirmed and a strong red candle formed, Place trade for 1 minute sell trade using the 15-second time frame.
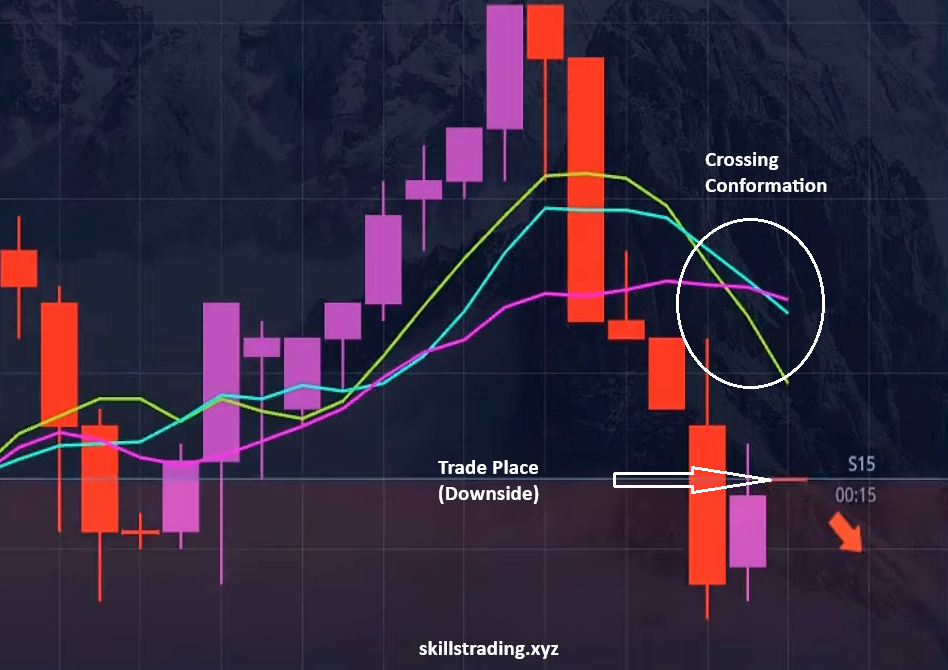
Follow proper risk management, and never let one loss affect your mindset. Consistency and discipline always win in the long run. This setup gives us high confidence that the price will likely move further down. The secret to success with this strategy is to wait patiently for this perfect crossover and only enter the trade after confirmation, not before. Even though we had a losing trade earlier, we’re staying disciplined and only taking trades when the signal is strong and clear
These are the indicators that made this strategy so powerful and easy to follow. SMA 1 period 7 type SMA 2 period 9 type SMA 3 period 14 type SMA.
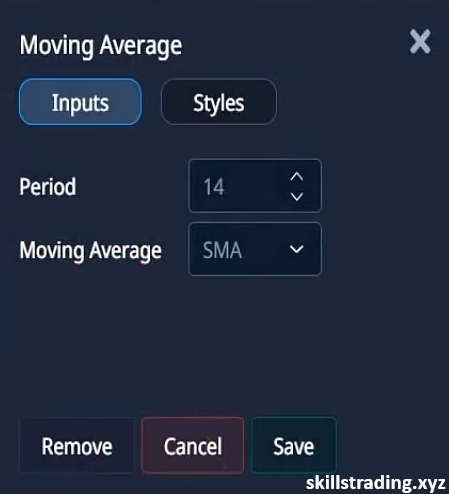
You can set these up easily on your chart by selecting move an average, adjusting the period as shown above, and choosing your favorite colors to keep things clear. Once all three SMAs are added, watch closely for the crossover. Follow the strategy rules as shown earlier and always apply proper risk management.
Conformation Sureshot Trade Strategy
FOR UP TREND SIGNAL
Indicators Settings
INDICATOR & OSCILLATOR
- •SMA – 5 green colour
- •SMA – 12 red colour
- •PARABOLIC SAR- 0.04
- •STOCHASTIC – %k= 12, %D= 5, m= 8
- •RSI – value= 7 TIMEFRAMES:-
- •CHART TIME:- 1 minute
- •TRADE TIME:- 3 minute
Get the Signal
If the parabolic sar below of the candles and SMA 5 crossing SMA 12 in Upward direction or at that time Stochastic line crossing 20 line in Upward direction and RSI crossing middle 50 line. At that time you can Trade.
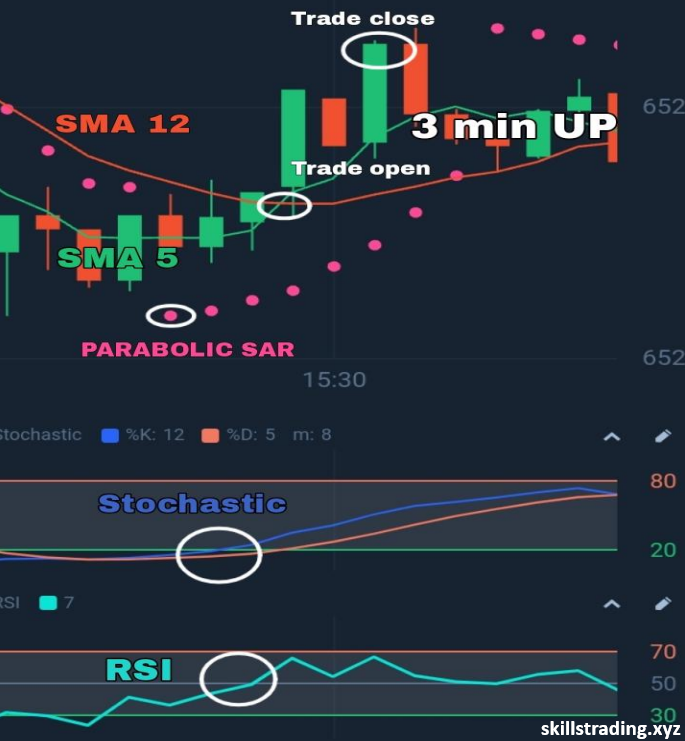
Conformation of Trade
- 1.parabolic below of the candles.
- SMA5 crossing SMA 12.
- Stochastic crossing 20 line.
- RSI crossing middle 50 line.
- If you get these all 4 conditions then you Trade if you do not get then Don’t trade
FOR DOWN TREND SIGNAL
Indicators settings
INDICATOR & OSCILLATOR
- SMA – 5 green color
- SMA – 12 red color
- PARABOLIC SAR- 0.04
- STOCHASTIC – %k= 12, %D= 5, m= 8
- RSI – value= 7 TIMEFRAMES:-
- CHART TIME:- 1 minute
- TRADE TIME:- 3 minute
Get the Signal
If the parabolic sar above of the candles and SMA 5 crossing SMA 12 in Downward direction or at that time Stochastic line crossing 80 line in Downward direction and RSI crossing middle 50 line. At that time you can Trade.
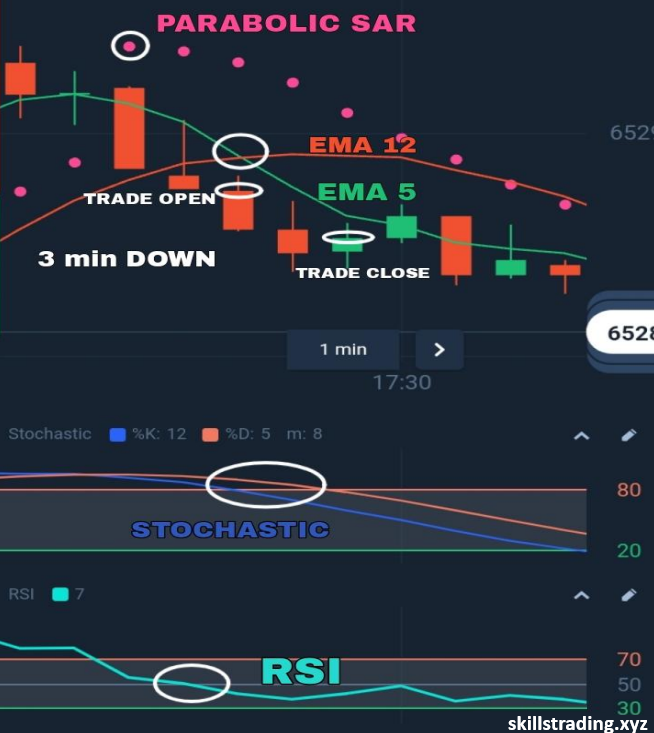
Conformations
- Parabolic Above of the candles.
- SMA5 crossing SMA 12.
- Stochastic crossing 80 line.
- RSI crossing middle 50 line.
- If you get these all 4 conditions then you Trade if you do not get then Don’t trade
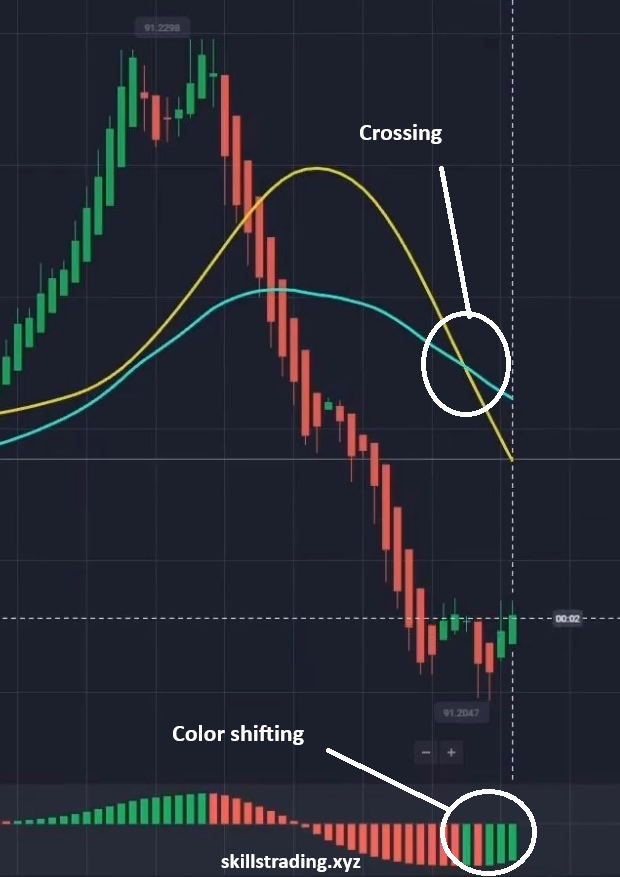
Strategy # 02 Explanation
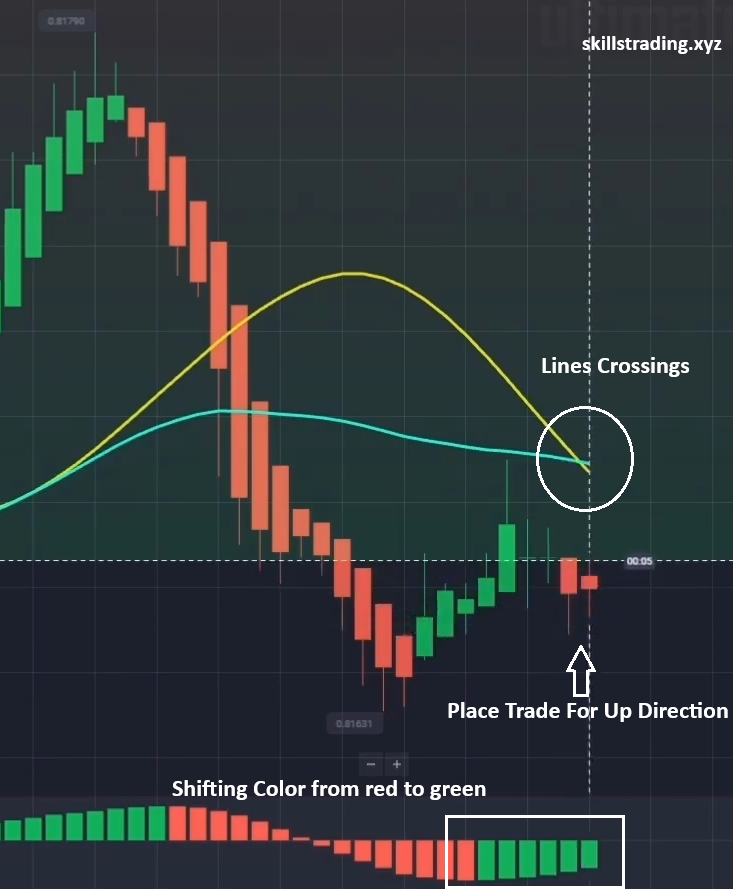
For this strategy we will using moving averages specifically the TMA on its yellow line and the WMA on its blue green line. Whenever both moving average lines cross there’s a high probability that the trend will successfully rise in the next minute, additionally we will utilize the awesome oscillator to complement our strategy. when it shifts its Trend and color from reaching its lowest Peak then we will trade Up side. The trend will gradually rise Until It Breaks through its Baseline the two Crossing Lines form an excellent combination for this trading method and ensure you trade at its optimal spot like this. Where both lines are in favorable condition it is similar to the awesome oscillator which shows strong momentum Peaks Shifting the red color to Green by using this strategy correctly you can achieve a higher success rate in your trades.
Finding trading opportunity
Chart time frame : 5 Seconds
Trade Time : 1 Minute
Both lines have crossed while our oscillator shifts from red to Green at the bottom level this is the best spot to trade higher as you can see here we have a high chance of winning in this spot it is clearly shown that the market will go for up side direction.
Another trading opportunity example
The two lines are about to cross and according to the awesome oscillator a reversal signal has already been generated however the trend seems to be transitioning smoothly toward a reversal and moving higher. Trade upward on this.
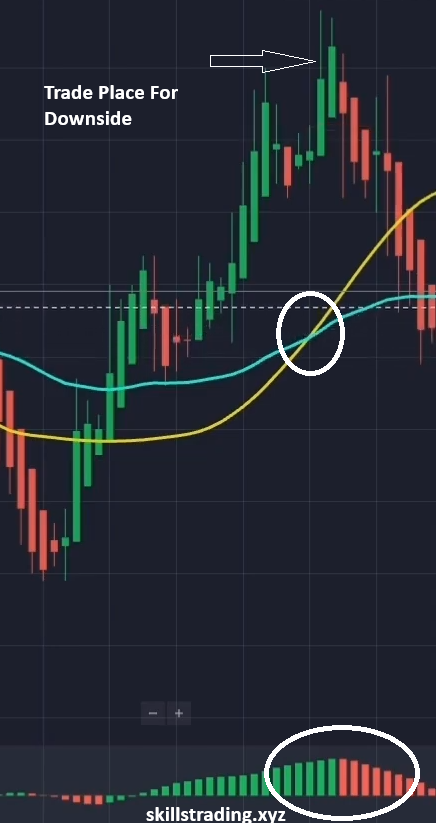
Looking at another scenario in the Tradowix Strategy, The two lines have already crossed as of now there is no reversal signal from the oscillator but we can assume it will form a reversal pattern soon in this case place trade for down side a shifting pattern is emerging here with the trend moving down.
We are using the 5-second trading candle as it provides the best analyzed data for quick Trading. Always trade responsibly and manage your risk effectively and avoid overtrading , set your SL and TP
For full indicator setups and download free mt4 indicators and bots, Visit our page
If you want more powerful strategies, trading tips like this Follow us.