Today I will share my favorite Quotex Trading Strategy candlestick patterns in quotex trading, just like this one that I use on a daily basis that way you can read and understand chart patterns predict chart direction become a more successful trader and make plays just like this one.
- Chart Time 1 Minute
- Trade Time 5 Minute
Use MTG according to your money management
In this Quotex Trading Strateg you may be feel that its for Forex treading but here we are talking about market trend, reversals that’s why we will use 5 min trade timeframe.
Engulfing candle Quotex Trading
It’s such a strong candlestick because it can give you the exact point of when a reversal is about to happen what is an engulfing candlestick well. it basically explains itself in the name it’s a candlestick in the opposite color of the previous candle and it simply engulfs it a bullish engulfing candle opens at or is lower than the previous candles close and closes above the previous candles open. so basically being bigger than the previous candle on both sides making it look as if. it’s engulfing it let me show you an example in below image, so here we found a pretty strong support where price bounced off it multiple times telling us it really respects it. we see the price comes back down to the support we can expect it to bounce back up but before entering we need a little more confirmation rather than just assuming the support will hold that. when we see a bullish engulfing candle it completely engulfs the previous red candle and is exactly at the support this is an extremely bullish sign and we can be pretty confident the price will go up.
In Quotex Trading Strateg note that just because there is a bullish or bearish engulfing candle doesn’t mean the price is going to reverse in that direction every time you shouldn’t be just trading purely off candlestick patterns you should be using them as almost if they were hints on which way the market is about to go not pure decision makers you should be using other tools with candlestick patterns like support and resistances indicators different strategies etc so just to be clear just because you see a bullish engulfing candle doesn’t mean the price will go up from there but it can be a good indicator that the price will head in that direction let me show you a bearish
Example
In Quotex Trading Strateg where we have the same type of setup a strong resistance where the price respected it multiple times before and we see the price comes back up and starts to slow down giving us a bearish engulfing candle completely engulfing the previous green candle we see that it got rejected at the resistance and there was a bearish engulfing candle indicating this is a good sign to go short.
And look what happens price goes down.
Momentum Candle in Quotex Trading Strategy
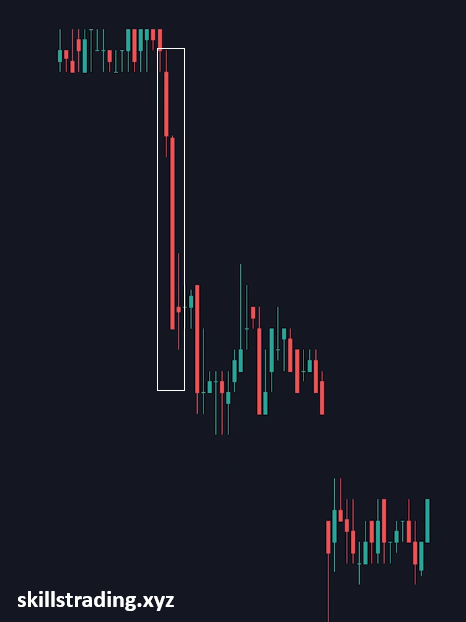
The momentum candle is a lot easier to spot than the engulfing candle purely because of its size. A momentum candle is simply a candle that is two to three times bigger than the previous candles, before it this candle can be insanely powerful because most of the time after it happens the price will continue to go in that direction. The most efficient and effective way to use this candlestick pattern.
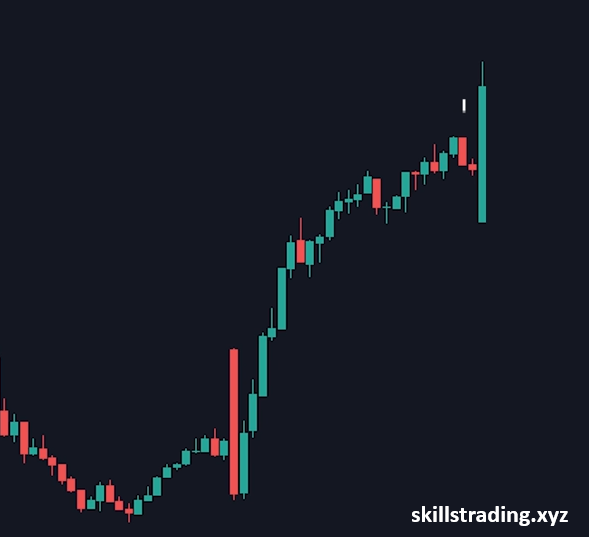
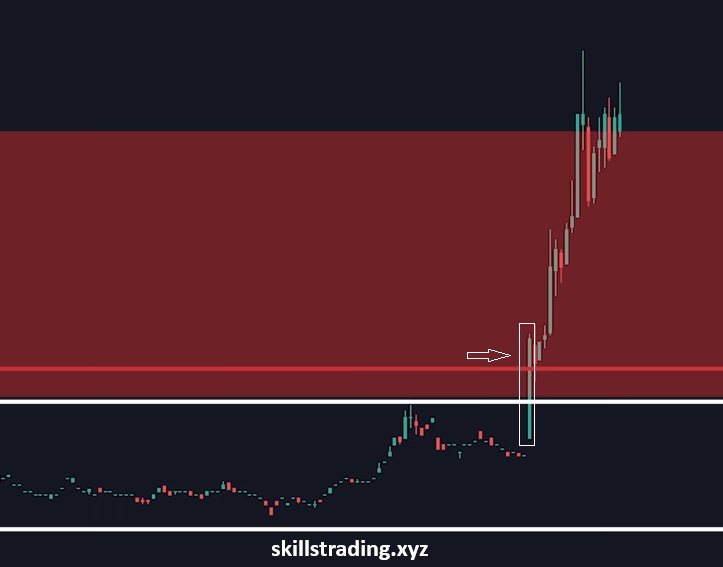
Where the price is moving sideways if you ever see a sideways market then a huge momentum candlestick appears being two to three times bigger than the previous candles you can be pretty certain that the price will continue in that direction. why is that well think of it like this whenever there is a sideways market like this there are a lot of Shorter’s stuck in their trades (Forex) they don’t want to exit their trade yet, because the price is moving sideways and it can honestly still move in either direction they draw their support and resistance and set their stop losses right above the support. So that means they’re going to be tons of traders setting stop losses all over this area meaning if there’s a sudden price movement and price hits this liquidation zone all these stop losses will be hit, just adding fuel to the fire for this price to keep moving up also when price breaks a sideways market like this it’ll usually start a trend in that direction.
Tt’s the same type of strategy with shorts if there’s a choppy sideways market and you see a huge red candle two to three times bigger than the candles before it this is a great indicator to enter a short position, because it’s likely the price will continue to move downwards.
Multiple candlestick patterns
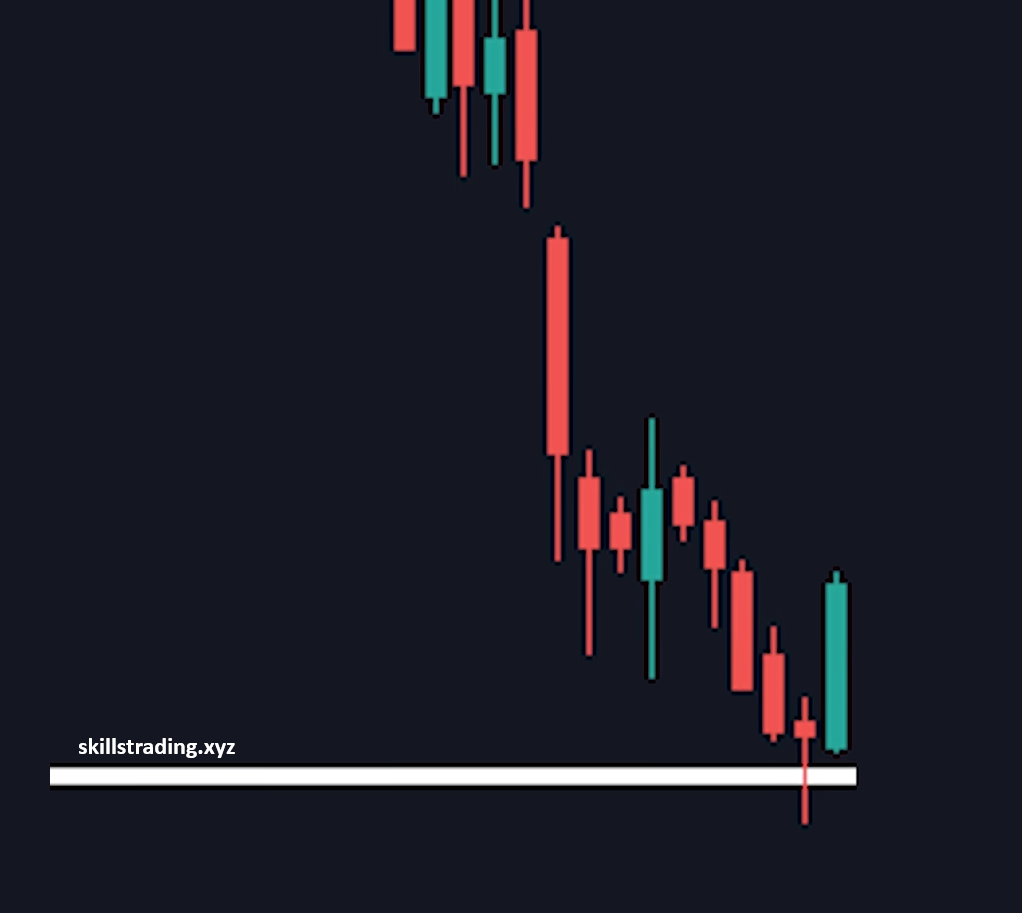
It usually holds pretty true on charts and it’s also pretty simple all it is is when you have three or more candles that have wicks going one direction the more candles the better. this candlestick pattern with support and resistances so look in below image, chart what do you see happening well for one we have a key support where price bounces off multiple times.
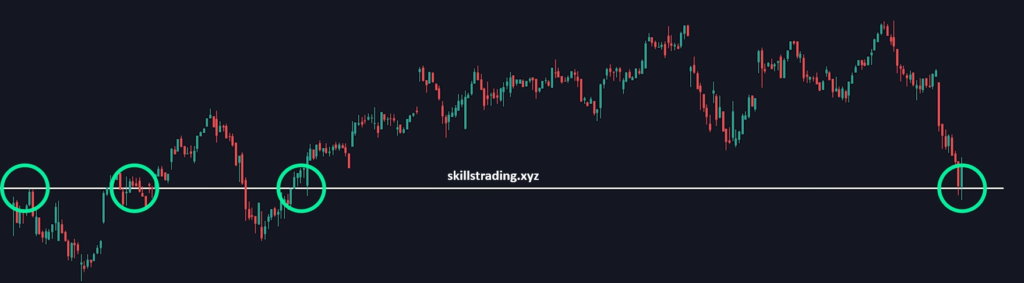
Then we have multiple candles with wicks going downwards exactly at the support, as you can see all these candles have downward wicks telling us that sellers are trying to break the support but buyers keep fighting them off and are winning multiple times confirming that. This is a key support and price has a good chance of bouncing upwards as said before the more candles the better the probability the price will respect that pattern.
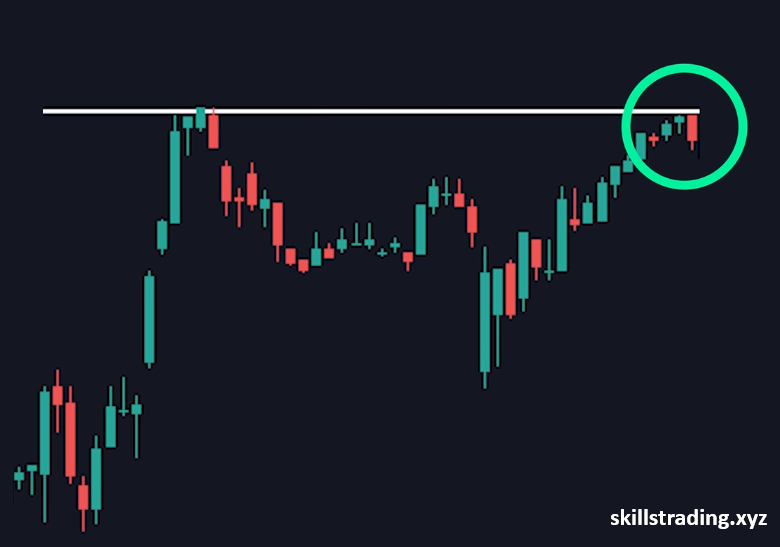
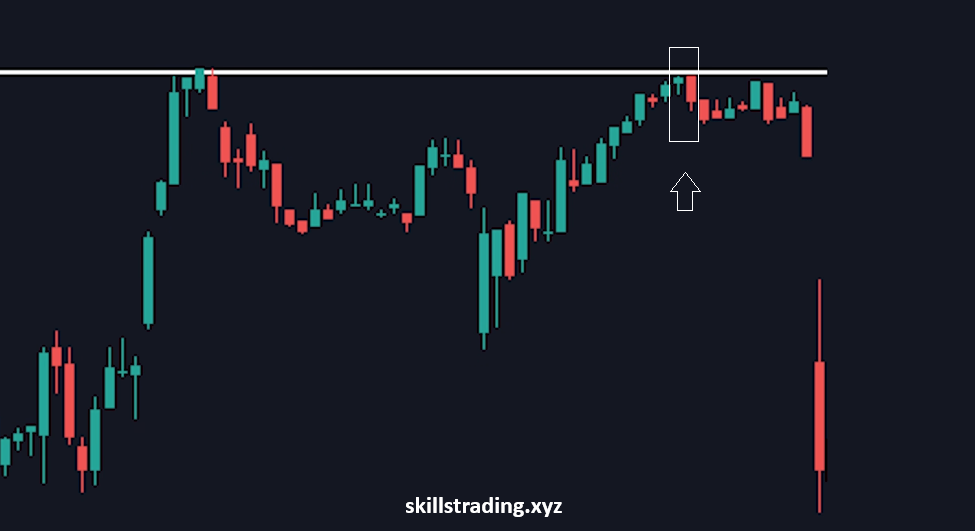
let’s go over a short example price moved to the resistance there are multiple candles with wicks heading upwards telling us that price really doesn’t want to move up from here giving us a good downside entry.
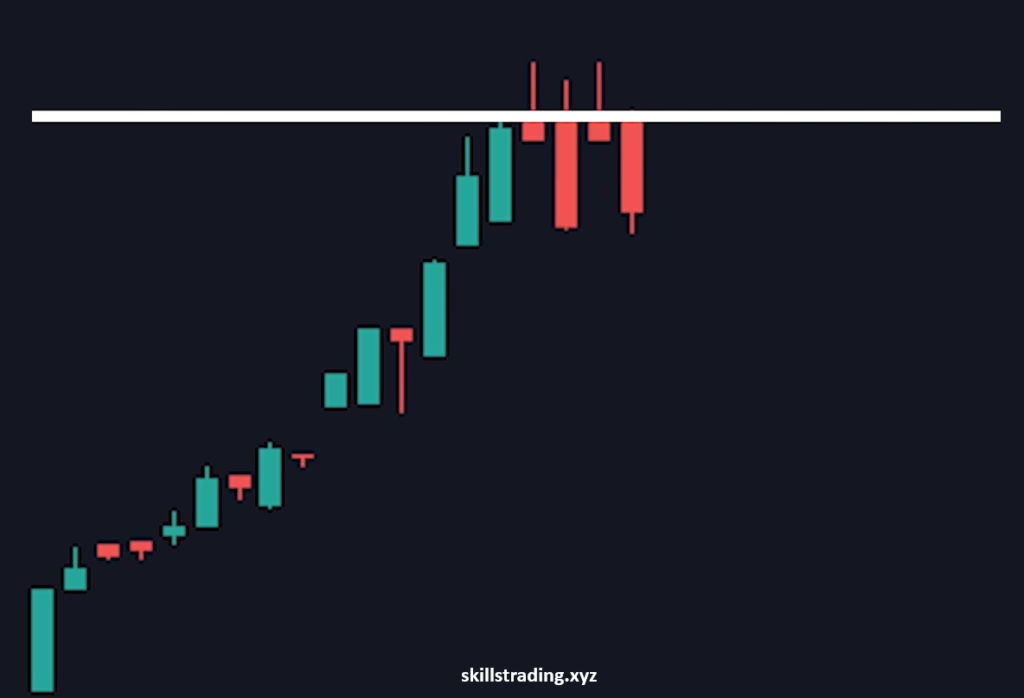
Here we are expecting that the price will goes in down side direction from this point and it does.
The Doji candle in Quotex Trading Strategy
The doji candle is a candlestick with a very thin body and it has wicks on each side, why this one is so important to understand is because it can be a great indicator on when the price is about to reverse in a direction. What this candle basically represents is the market is uncertain on which way it wants to go and is having resistance whenever there is uncertainty or resistance the price will more often than not head in the opposite direction.
let’s see an example in below image. so here we have price moving down pretty hard then a green candle appears and it just so happens to be a doji candle this is telling us that sellers are starting to be less confident and buyers are starting to enter making this point a great potential place to enter. what we normally like to do with doji candles is after we see one we will wait for two or more candles the same color to confirm that the price will reverse.
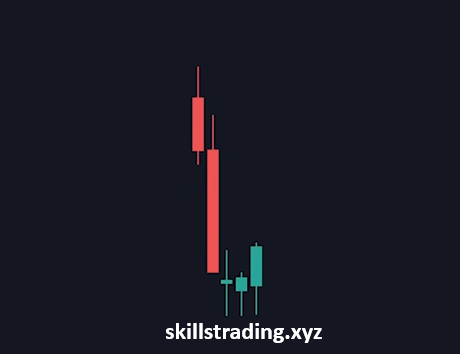
After a green doji and two more green candles heading upward this telling us that the price will continue in that direction so this is the.
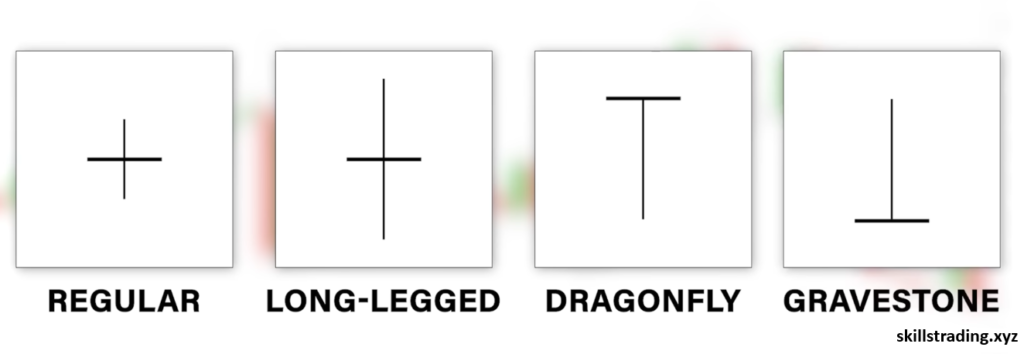
There are multiple different variations of the doji candle, that you might see there is the regular one which is the one that we just talked about in the last Image the long-legged doji candle, which is basically the same candle but just has larger wicks. The dragonfly which has a small body and a big bottom wick then the gravestone which has a small body and has a big upper wick all of these tell the same exact story a reversal in price.
If you like our strategies and articles , leave comments and we will try to post more quotex trading strategies. Don’t forget to visit our all strategies section. Thanks