
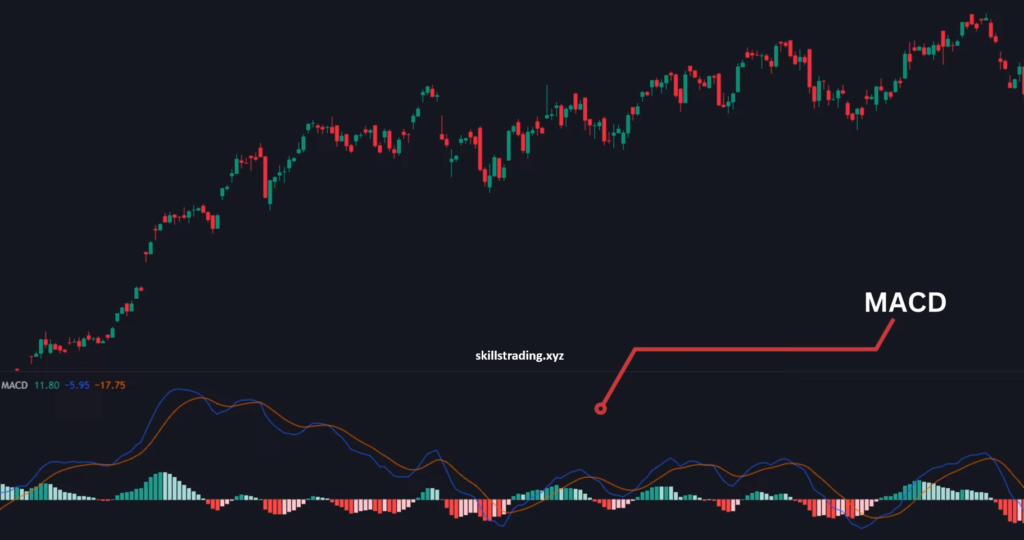
The best Binary Options Trading Strategy/ 5 Second Quotex Bug is MACD trading strategy, MACD stands for Moving Average Convergence Divergence. learning which can help you generate significant profits. The MACD is a very popular indicator used by traders, but many people make the mistake of using it alone.
MACD bullish crossover and bearish crossover (Quotex Bug)
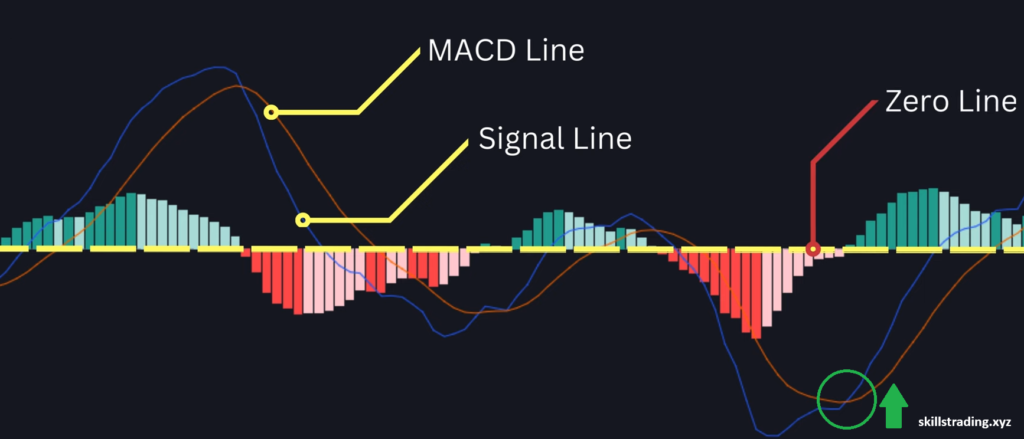
Bullish crossover
The MACD primarily consists of two lines: the MACD line and the single line. These two lines provide signals for buy and sell during crossovers. When the MACD line crosses the signal line from bottom to top below the zero line, it is a bullish crossover, meaning it is a buy signal.
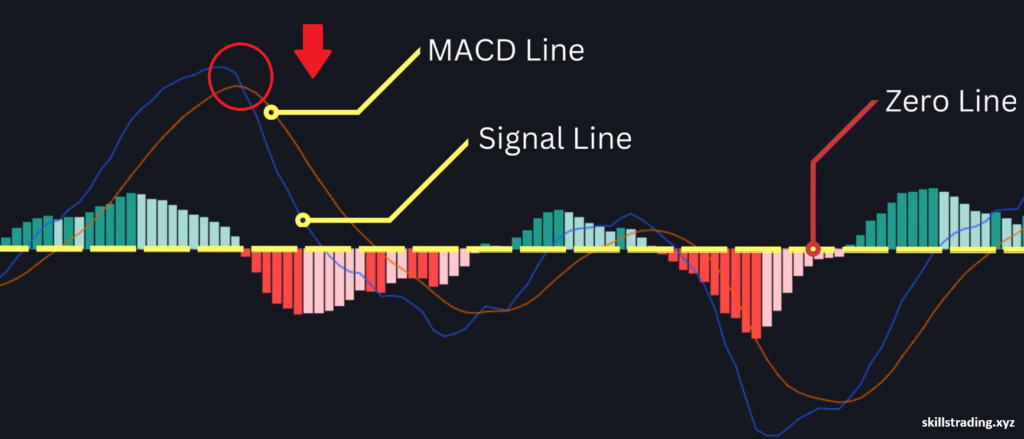
Bearish crossover
When the MACD line crosses the signal line from top to bottom above the zero line, it is a bearish signal, meaning it is a sell signal.
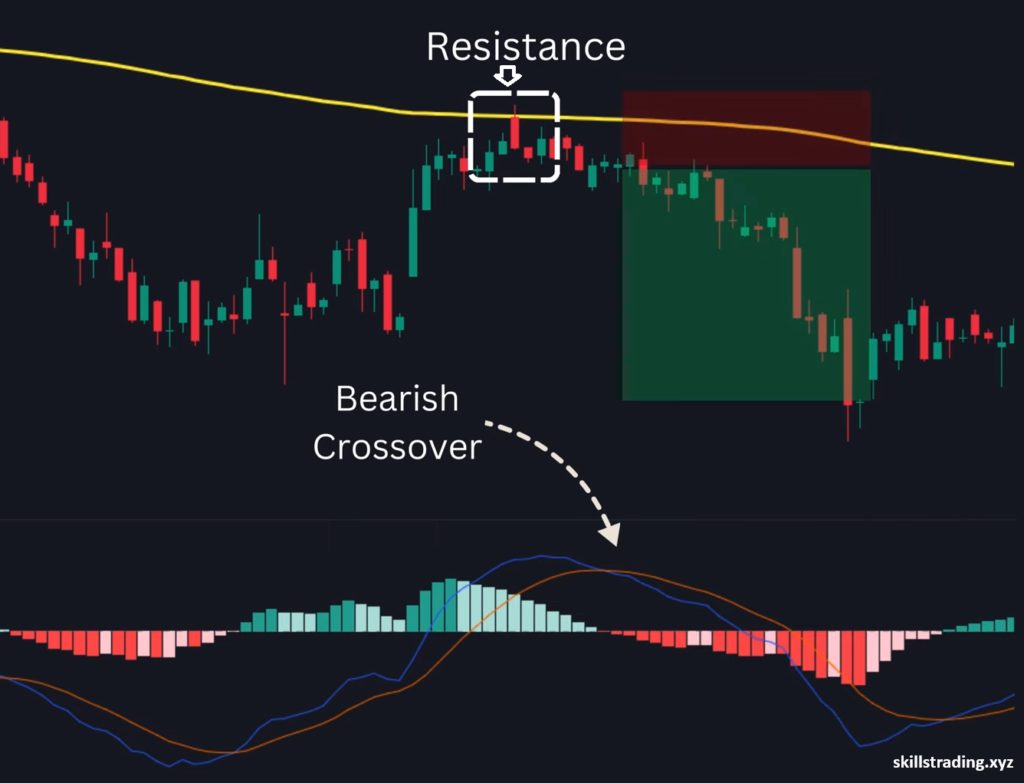
If you understand this much, then let’s move on to theBinary Options Trading Strategy. For our Quotex Bug strategy, we will use the 200 x 100 x exponential moving average along with MACD. Quotex Bug is very simple. In this strategy, we will use the 200 x exponential moving average as support and resistance. When the 200 x exponential moving average is above the price, it acts as a resistance.
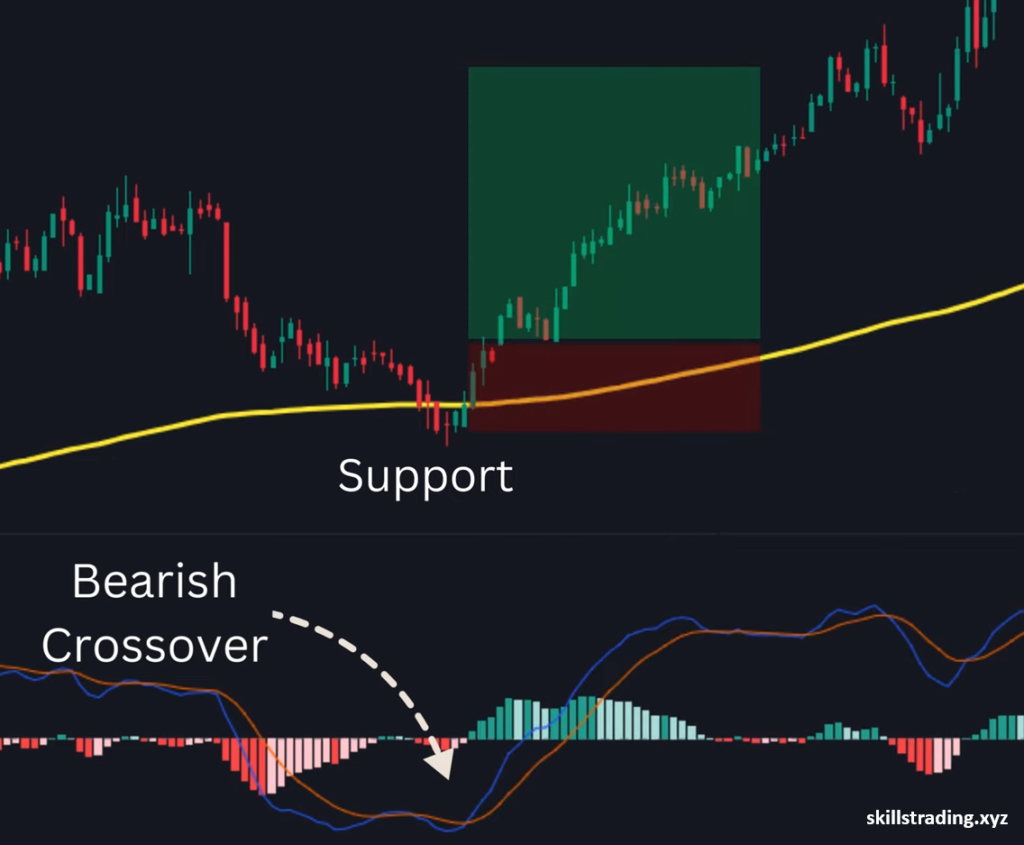
And when the 200-exposure moving average is below the price, it acts as support. Let’s understand the strategy with the help of an example. Here you will see that the moving average is above the price, which means the moving average will act as resistance. Next, you will see that at this point the stock price has come close to the moving average.
From here, there is a possibility that the stock price may go down from here. So, for confirmation, you have to wait for the bearish crossover of MACD. If in this case, a bearish crossover occurs above the zero line price and the stock price is still below the moving average, then you can sell here. Trade time for 5 to 15 minute, and if this trades loss use 1 step MTG.
Let’s look at another example, here you will see that the moving average price is below the candle, which means the moving average will act as support. Next, you will see that at this point the stock price has come close to the moving average. From here, there is a possibility that the stock price may go back upwards. Therefore, for confirmation, you have to wait for the bullish crossover of MACD. A bullish crossover occurs below the zero line, and the price of the candle here is still above the moving average. So, you can buy here. Trade time for 5 to 15 minute, and if this trades loss use 1 step MTG.
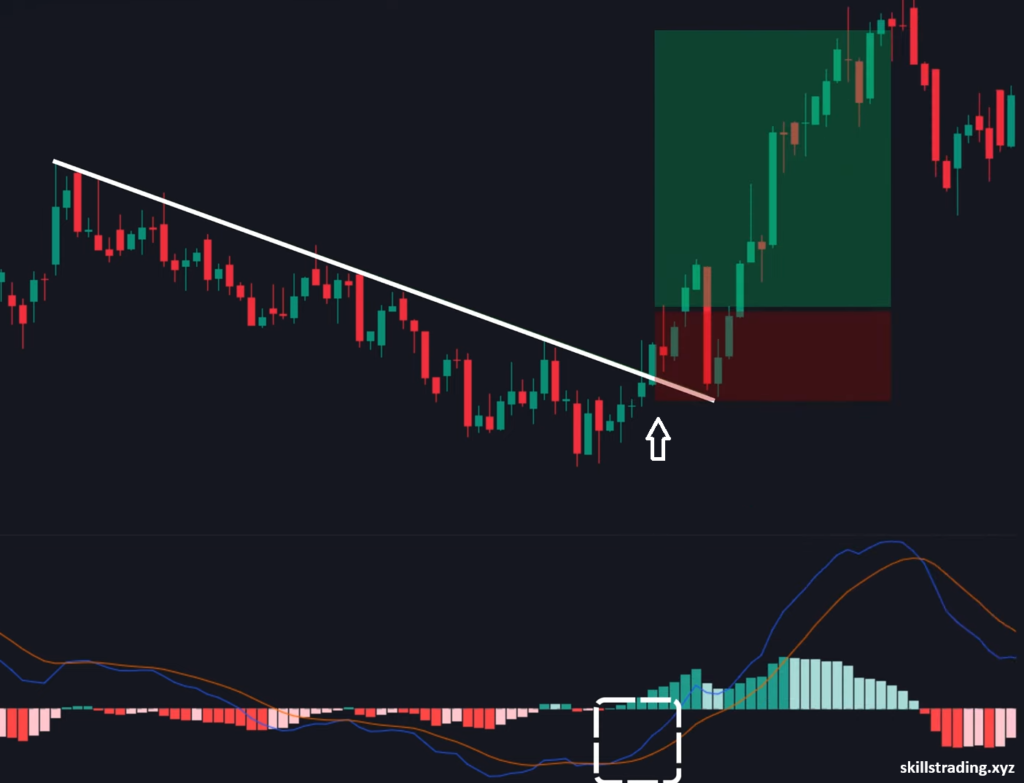
In our next Bearish crossover example in Binary Options Trading Strategy, we will use MACD combined with price action. Here, you will see a down trend. The stock is moving down, making lower lows and lower highs. Because this is a down trend, we will draw a trend line above the price. Here, you will see that the price rejects multiple times at this level and moves down. So, we drew a trend line at this level. Next, you will see that a bullish crossover occurs in AD at this point, but you should not take any trade immediately. You should wait for the breakout of the trend line. Next, at this point, a green candle breaks the trend line. If the high of this green candle is broken the next candle, you can buy here.
You will see that the stock is in an up trend. The stock is moving upward, making higher highs and higher lows. Because this is an up trend, we will draw a trend line below the price. We will draw it. Next, you will see that at this point there is a bearish crossover in MACD, but we do not have to take an immediate trade, we have to wait for the breakout of the trend line. Next, you will see at this point that this red candle has broken the trend line. If next candle any candle breaks the low of this candle, then you can sell here. If you people do not know how to draw a trend line or level of support and level of resistance. For more examples you can contact us.