Volume and Price Action Top Strategy, The big players can easily manipulate prices , but they can’t manipulate volume-not easily. Volume feed is very useful. You can actually tell from price and volume relationships whether somebody’s playing with you or not. The markets are constantly manipulated against you. Every single day, the market is manipulated in some way by big hedge funds, institutions, and large amounts of money that can artificially drive the price up and artificially drive the price down. And it’s meant to do just one thing : take advantage of the average retail investor like you and me, scare us out of our positions, and use us as liquidity. To prove my point even more, here’s an interview with an ex-hedge fund manager, Jim Cramer. He kind of has a reputation, but everything he is saying in this interview is actually happening on a day-to-day basis in the markets. A lot of times when I was short at my hedge fund and I was positioned short, meaning I needed it to go down, I would create a level of activity beforehand that could drive the futures. It doesn’t take much money. I don’t need to commit maybe 5 million in capital to do it, and I could affect it. You can move it up and then fade it. That often creates a very negative feel.
That’s a strategy very worth pursuing . I would encourage anyone who’s in the hedge fund game to do it because it’s legal and is a very quick way to make money and very satisfying.
Your sole strategy just uses price action and price action alone. I can guarantee you that strategy will not work in the long run because this manipulation tactic they use will falsely exit you out of your positions. But here’s the good news : while yes, the big players can easily manipulate prices , they can’t so easily manipulate volume, which is exactly why we need to add it to our current strategy. When talking about charts, you can look at two things : price- did it go up, down, or sideways? But price is limited because it just shows you the outcome of what happened. And as we proved before, that outcome can be manipulated. The second way of looking at a chart is by looking at the volume. Volume shows you how much conviction was actually behind that movement , how many traders participated, and how much money was injected into the market to make that move happen. You can almost think of it like an election. Price is the equivalent of the president who won. So again, you are just seeing the outcome. But volume shows you the number of voters each side had. For example, say if we just had two people vote for the next president – your uncle and your aunt . The result wouldn’t really mean anything. Two people voting is not enough to get a good consensus on who’s going to win the next election. But if we had a hundred million people show up and vote, well, now that’s a different story. It’s the same thing with trading. If you have a big green candle with low volume, that’s pretty suspicious. If you have a big green candle with high volume, that’s conviction. So you shouldn’t be asking where the price went; you should be asking how much money it took for the price to get to that point. Now, I know when first using the volume indicator, it can be super confusing. You don’t really know what to look for. Should you be buying when it’s green, selling when it’s red, big, small, what do I do? To help you out with this, I have a simple blueprint to simplify everything. There are only three scenarios that you really need to know.
The first scenario is the healthy scenario, which is what you want to see. In this scenario, you have a big green candle with high volume, showing large amounts of money supporting this move. Lots of money is coming in, and the chart agrees with that. This is exactly what you want to see. But that all changes if this scenario occurs . If you have a small candle with large amounts of volume, this is a huge red flag. You see, whenever you have a small candle with large amounts of volume, it shows large amounts of money are coming into the market, but the price isn’t moving, which means the money is being absorbed. The buyers are pushing hard, but there’s an invisible wall, or in other words, a large seller absorbing the buyers. So, here there’s a small candle, but if we look at the volume, there was a ton of it , showing the buyers are being absorbed by a big seller.
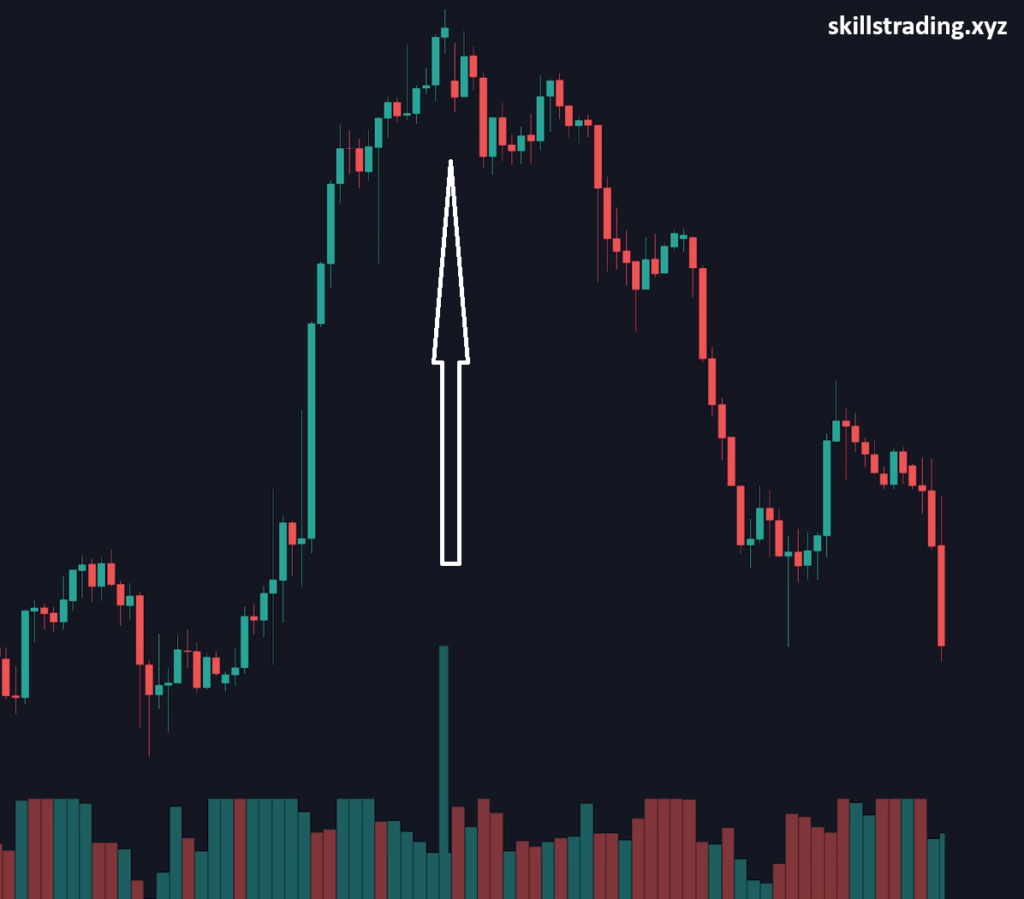
And look what happens ; the price falls shortly after. Okay, so in both of the previous examples, the volume was high. But what happens if the volume is low? Well, if the volume is low, showing there isn’t a lot of activity, yet the chart is still going up, this just shows there’s no supply, or in other words, the sellers are absent and there’s no friction against the buyers. So, the buyers can push up the price easily because there’s no competition. Now, I know what some of you are thinking. What if the volume bar is red? Or what if the volume bar is green? Then what? To answer that question, which trading law? A super common misconception about volume is that green volume means buying and red volume means selling, which is completely not true. You see, every trade requires a buyer and a seller. So, if you bought 69 shares, that means someone out there sold you 69 shares. For every buyer, there’s a seller ; no exception. Volume is simply the amount of transactions that took place, not who’s winning. So, a common misconception that I see the majority of traders make is they see a red volume bar and instantly think there is more selling activity, which is not always the case. The color of the volume bar is simply just matching the color of the candle above it.
So, if we go to our chart,Volume strategy you can see we have a red candle. And if we look directly below that, we have a red volume bar. We have another red candle ; we have another red volume bar. We have a green candle ; we have a green volume bar. The point I’m trying to get into your head is that the color of the volume bar has nothing to do with who is buying and who is selling. It just shows if the price closed above or below where it opened. So, in reality, for the most part, the color of the volume bar is pretty irrelevant. All we care about is the size of the volume bar. So, putting all of this together, we can formulate a pretty good strategy for predicting what the price is about to do based on the volume. If the price is going up and the volume is going up, that shows a strong uptrend. If the price is going down and the volume is going down, that indicates the sellers are getting weaker.
That’s pretty obvious. But, when they start moving opposite of each other, that’s when the true signals start revealing themselves. And the best part is, this strategy isn’t just for one market.
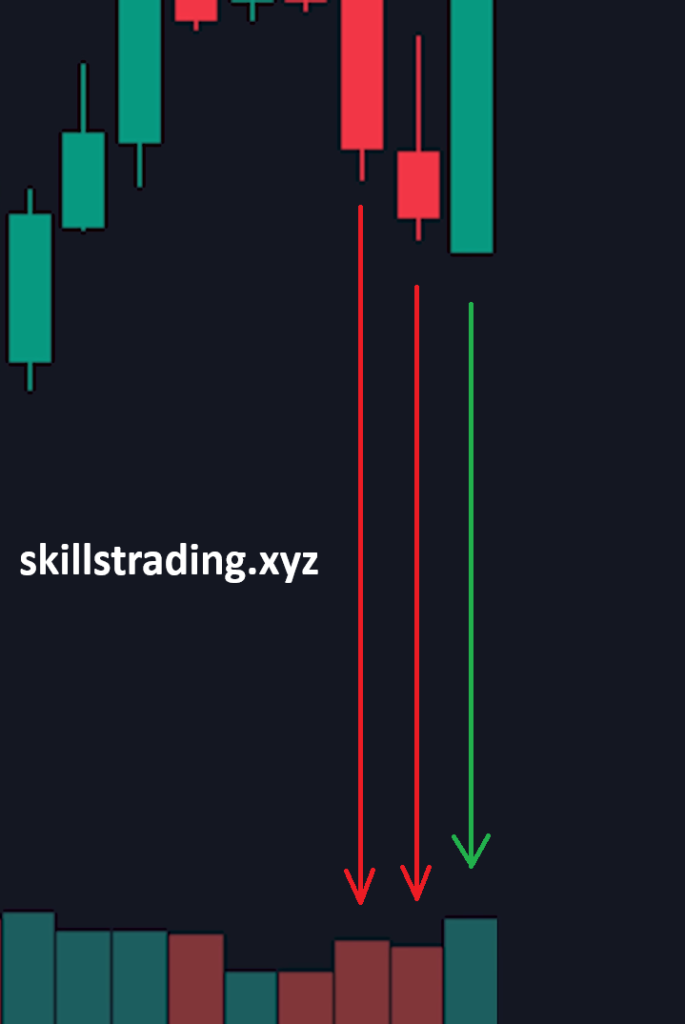
The volume concept works for every market out there : crypto , stocks, gold, whatever. Volume exists in every market. If you trade multiple markets, and if we look at this chart, price is moving upward . We’re making higher highs and higher lows. So, if you are a price action trader and are looking at price action and price action alone, you might be sitting there thinking this is a very strong uptrend. However, the moment we look at the volume, it tells us a completely different story. Even though the price is going up, the volume is getting weaker. With every new high that the price makes , there are fewer and fewer transactions happening, and the volume is decreasing , which shows weakness. With this weakness, you could easily predict the price is about to fall because of the lack of volume, which is exactly what happens. The same exact reasoning applies to the opposite scenario. If we have a strong downtrend, with price making lower lows and lower highs, but we look at the volume and see that the volume is getting weaker as well, this indicates that the sellers are getting exhausted. Each drop in price has fewer and fewer transactions, which means the selling is becoming weaker, often signaling a bottom is forming, which again is exactly what happens. To combine everything we have just learned into your current strategy, all you have to do is follow these simple steps.
Trading View, Volume and Price Action Top Strategy
First, go to TradingView . If you don’t have it yet , I’ll leave a link in my description. Go to your chart and select a larger time frame, like the daily. Access the indicators tab, search for volume, and click on the default one. Before you even look at the price action, check the volume first. Zoom out on your chart and simply observe what the volume is doing. Is the volume increasing? Is the volume decreasing? Are there any unusual volume spikes? Once you answer those questions, the next step is to apply it to your strategy. Say you are using supply and demand. I’ve made multiple strategy videos using supply and demand ; it’s basically just the start of a strong uptrend or the beginning of a strong downtrend. You can almost think of it as support and resistance. In my opinion, supply and demand is more accurate, but I’m just trying to explain it very simply. Mark your supply and demand areas on the chart. If the price comes up to your supply area , or in other words, a resistance, and then prints a small candle with large volumes , this shows that sellers are absorbing the buyers, which means your supply zone is likely very strong. However , if the price has a big green candle breaking your supply area with large volumes , this instantly indicates that the supply level is likely very weak. Volume can be a little confusing, and I know this from experience.
Hopefully, it helps, and hopefully, you learn something from this. For more strategies tips and general discussion visit.